10 Top JavaScript Charts and Graphs Libraries
People today struggle more with the issue of disorganized attention. If you have a sophisticated business application, gathering, synthesizing, and engagingly showing any information is essential.
It is inconvenient to provide enormous amounts of data for analysis or study on a typical spreadsheet. We will create various charts, especially JavaScript charts.
For the presentation of data, a JavaScript chart is a crucial component of a web application. JavaScript charting libraries are, therefore, unavoidable. Because of how the brain is wired, it interprets visual information better than any other type.
No matter how carefully explained, clearly-visualized data has significantly more impact than data provided in its raw form. Learn more about some of the best JavaScript charting libraries by reading on.
Why is a Charting Library Important?
The significance of data-driven judgments in a quick-paced economy cannot be overstated. As a result, companies increasingly use a JavaScript chart library to produce maps. It makes it easier to comprehend and extrapolate business ideals as a consequence.
An essential component of a web service for displaying data are JavaScript charts. JavaScript graphing tools are therefore necessary.
The human brain understands visual input better than any other type because of it’s design. Therefore, regardless of how thoroughly explained, appropriately displayed data has a considerably more powerful impact than data supplied in its natural form.
What are the Top JavaScript Charts Libraries?
Let’s quickly go over the top 10 and determine which is the greatest.
Is FusionCharts the Top JavaScript Charts Library for Data Visualization?
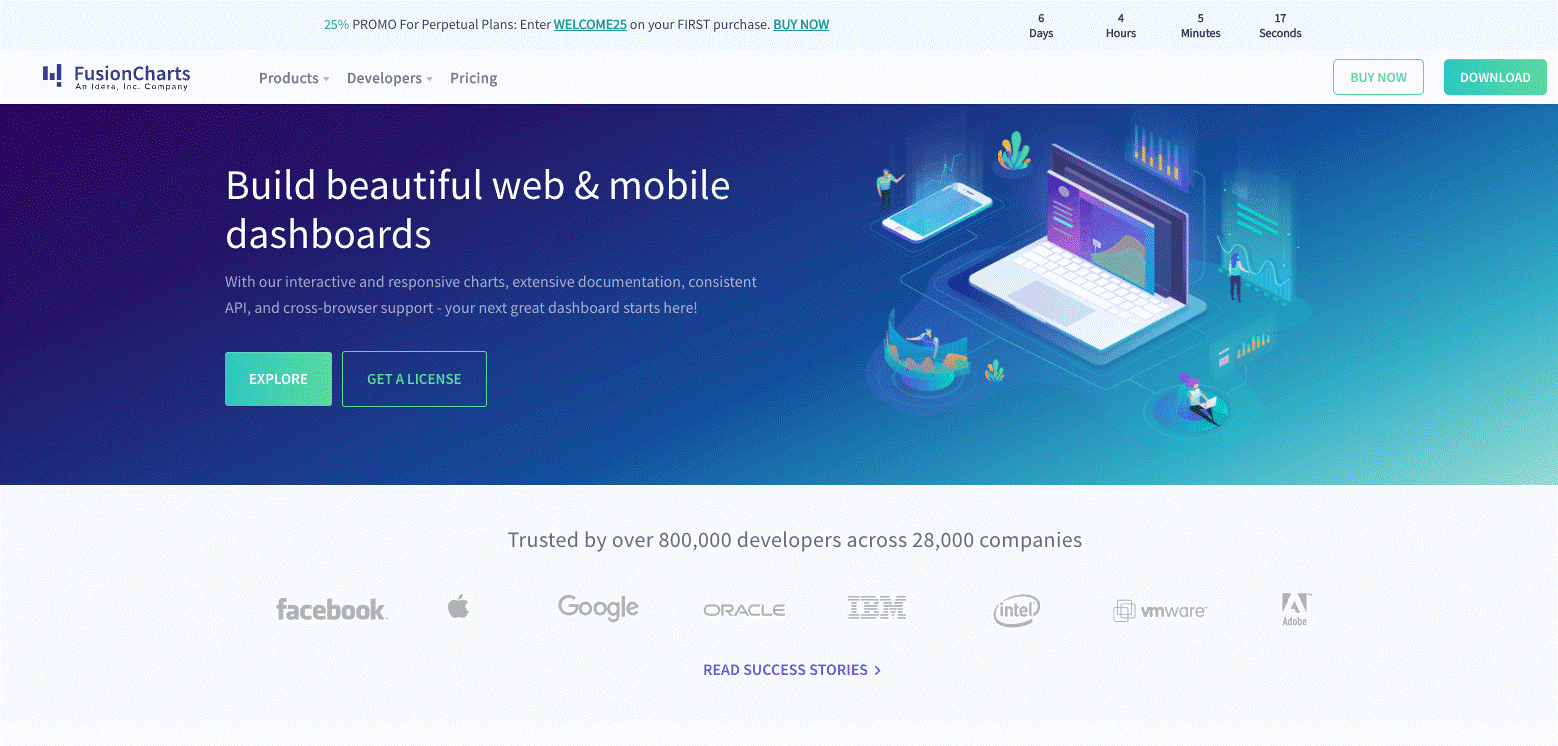
FusionCharts, one of the most popular frameworks for data visualization on the internet, has an astounding array of features that make it perfect for many data visualizations.
The creation of FusionCharts by developers, making it one of the best frameworks for creating charts, is important considering its importance.
In addition to constantly updated and error-free source codes, this portal provides several graph examples.
Additionally, it provides one-on-one support to quickly fix technical issues and thorough tutorials on numerous dashboards and visualizations to help you understand all your options.
It is well-liked because of how easily it can be customized and how easy it is to use. Additionally, you may alter your charts using whatever graphical or functional method you choose using FusionCharts Suite.
For instance, you could add more layers and customize the charts using attributes, or you might create complex visualizations utilizing our events and API.
For displaying business data like earnings by zone, level of labor by state, and office locations, FusionMaps XT offers over 2000+ worldwide maps, including all countries, US states, and regions in Europe.
FusionCharts is a well-liked tool used today to create dashboards for web applications with various graphs and charts.
What is Plotly.js?
The first academic JavaScript charting library on the web is Plotly.js. Since 2015, it has been open-source, allowing anybody to use it without paying. Twenty different types of charts are supported by Plotly.js, including statistical graphs, 3D charts, and SVG maps. Construction of Plotly.js took place by using stack.gl and D3.js.
What are Google Charts?
Google Charts is a fantastic option for straightforward applications that don’t require intricate customization. It offers a wide variety of pre-built charts, including bar charts, pie charts, calendar charts, area charts, and more. In addition, every chart is interactive, and you can quickly add it to your page.
Read more on Google Chart’s alternative in the blog.
What is Flexmonster?
Flexmonster is a group of web-based tools for visualizing data. Data sets from external databases may be imported, examined, or modified directly in the user interface. It may also connect to several data sources at once.
It supports PostgreSQL, MySQL, Google Datastore, and Amazon Redshift, in addition to other databases. Additionally, it provides over 50 data visualization components, such as charts, tables, maps, and dashboards, for clients to use in their web programs to handle data.
What is Charts.js?
Users looking for a creative and simple solution can check out the excellent and compact JavaScript library known as Charts.js. It contains numerous charts, including bubble charts, mixed charts, and scatter plots.
Chart.js renders using the canvas element to maintain scale granularity and is responsive to window resizing. Internet Explorer 9 has backward compatibility. Additionally, polyfills for Web Browsers 7 exist. Chart.js, which is free, includes charts that are simple to alter. The resulting Java charts also support several plugins with thorough documentation.
What is D3.js?
A JavaScript library with a BSD License, D3.js is open-source. It includes several striking graphs, charts, and other data visualization techniques. Additionally, this open-source framework provides you with the tools necessary to visualize your data.
It provides browser compatibility across all popular browsers. Additionally, you will receive thorough instructions and examples that will make it easier for you to comprehend the library.
What is Recharts?
Recharts is an open-source Javascript library built on React. It creates attractive and dynamic charts using SVG components and is lightweight. In addition, Rechart has excellent helpful documentation that makes it very easy to use and understand the library.
Moreover, it offers general chart settings that are already built-in, including legend tooltips, which work well with static graphs. Additionally, you can access line charts, bar charts, pie charts, and area charts, which are useful for representing any data.
What is HighCharts?
HighchartTable is a plugin that, although seeming like it’s creation was to display HTML tables, converts tabular data into graphs.
This Highcharts-based jQuery plugin is also based on a separate library. Therefore, making Highchart Table work involves first including the two dependencies. After that, you can transform the design into a full chart by creating an HTML table.
What is ZingChart?
To quickly create charts, ZingChart delivers a versatile, interactive, quick, scalable, and contemporary tool. Their product used by businesses like Apple, Microsoft, Adobe, Boeing, and Cisco, leverages HTML5, JSON, and Ajax to generate attractive charts instantly.
More than 35 customizable chart styles and modules are available from ZingChart and can display data in real-time. They can quickly present enormous data and be styled and personalized using CSS.
What is amCharts?
AmCharts’ modern, svelte, and quick charts offer improved data visualization straight out of the box. You may easily accomplish that whether you need to directly integrate libraries with React, TypeScript, Angular, Vue, or straightforward JavaScript applications.
Which JavaScript Charts Library is the Best?
We discussed about 10 best JavaScript Charts Libraries that provide top-notch technical support. Assistance is needed whenever a user encounters difficulty or requests an explanation of a rule or function since unsatisfied consumers are not loyal.
You won’t have to worry about anything after one of these libraries is set up since you’ll receive first-rate support to assist you in presenting your data.
What are some of the FAQs about JavaScript Charts?
Can JavaScript Be Used to Generate a Graph?
A JavaScript charting package called JSCharting uses SVG to create various charts. It is suitable for this lesson since it is simple to use and learn.
Are There Any Other Programming Languages That Support Charting?
It is, indeed. Charting is also possible in R, Python, C/C++, and Go in addition to JS.
Could You Go Over Some Typical Uses for Data Visualization?
Currently, the most popular application is as a business intelligence reporting tool (BI). Users can set up visualization tools to automatically produce dashboards that track key performance indicators (KPIs) for company performance and graphically represent the results.
Is JavaScript Effective for Displaying Data?
For data scientists interested in developing intricate data visualizations and project portfolios, JavaScript is a valuable programming language because it is also recognized for producing distinctive and captivating visual experiences.
Facebook Official Page: All PHP Tricks
Twitter Official Page: All PHP Tricks