How to Create and Update Chart using JavaScript
In this tutorial, we will learn about how to Create and Update Chart using JavaScript with easy and step by step guide.
First we will learn that how to create chart using JavaScript after that we will also learn how to update chart using JavaScript.
Now a days, creating and updating chart using JavaScript is very important. Sometimes, you may need to display data in visual form either to user or admin.
For this purpose, there are several JavaScript libraries available, we are going to use the Canvas JS library.
Steps to Create Chart using JavaScript
Follow the below simple and step by step guide to create a chart using JavaScript library Canvas JS.
- Create a Database
- Create a Table of Team Marks and Dump Data
- Fetch Data From Database to Pass in JavaScript
- Create a Chart using JavaScript
1. Create a Database
To create a database, go to phpmyadmin and click on database tab, enter your database name and click on create button to create a database.
Or simply execute the below query to create a database.
CREATE DATABASE allphptricks;2. Create a Table of Team Marks and Dump Data
To create table, execute the below query in phpmyadmin in SQL.
CREATE TABLE `team_marks` (
  `id` int(11) NOT NULL AUTO_INCREMENT,
  `team_name` varchar(50) NOT NULL,
  `marks` int(11) NOT NULL,
  `status` int(1) NOT NULL,
  `created_at` datetime NOT NULL DEFAULT CURRENT_TIMESTAMP,
    PRIMARY KEY (`id`)
);
Now run the below query to dump data in table.
INSERT INTO `team_marks` (`id`, `team_name`, `marks`, `status`) VALUES
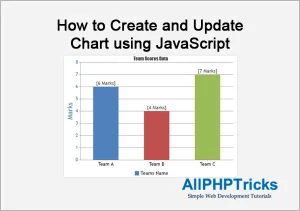
(1, 'Team A', 5, 1),
(2, 'Team B', 8, 1),
(3, 'Team C', 6, 1),
(4, 'Team A', 6, 2),
(5, 'Team B', 4, 2),
(6, 'Team C', 7, 2);We are going to use these data to create a chart in JavaScript, we will fetch all the records of status=1.
3. Fetch Data From Database to Pass in JavaScript
We will fetch the data from database, dbclass.php file is included in the download file of this tutorial.
Create an index.php file and copy paste the following code in it.
<?php
require_once('dbclass.php');
$db = new DB;
$db->query("SELECT `team_name` as label, `marks` as y, CONCAT('[', `marks`, ' Marks]') AS indexLabel FROM `team_marks` WHERE `status`=1");
$rows = $db->resultSet();
$db->close();
$dataPoints = array();
foreach($rows as $row){
    $dataPoints[] = $row;
}
$dataPoints = json_encode($dataPoints, JSON_NUMERIC_CHECK);
?>
4. Create a Chart using JavaScript
Now, we need to create a chart using JavaScript, first create an HTML placeholder of chart having unique ID and add Canvas JS library in footer.
Copy and paste the below code in index.php file.
<div id="AllPHPTricks_Chart" style="height: 600px;">
</div>
<script src="https://cdn.canvasjs.com/canvasjs.min.js"></script>
Now, we need to pass the data to JavaScript code and create a chart using JavaScript, simply copy and paste the below code in index.php.
var data_points = <?php echo $dataPoints;?>;

var chart = new CanvasJS.Chart("AllPHPTricks_Chart", {
    animationEnabled: true,
    animationDuration: 2000, // Set animation duration in milliseconds
title:{
  text: "AllPHPTricks",
},
subtitles: [{
  text: "Team Scores Data"
}],
axisY: {
  title: "Marks",
  titleFontColor: "#4F81BC",
  lineColor: "#4F81BC",
  labelFontColor: "#4F81BC",
  tickColor: "#4F81BC",
  includeZero: true
},
data: [{
  type: "column",
  name: "Teams Name",
  showInLegend: true,
  yValueFormatString: "#,##0.# ",
  dataPoints: data_points
}
]
});
chart.render();
Steps to Update Chart using JavaScript
Follow the below easy and step by step guide to update the above created chart using JavaScript.
- Create ajax.php file
- Update a Chart using JavaScript
1. Create ajax.php file
Create an ajax.php file and paste the following code in it.
session_start();
if(isset($_POST['request']) && $_POST['request']=='data'){
	require_once('dbclass.php');

	// We are changing status value to fetch different data from DB to change values on chart
	// You may do not need to use this, as you will be getting updated data from DB
	if(isset($_SESSION['chart_id']) && $_SESSION['chart_id']==2){
		$status = 1;
		$_SESSION['chart_id']=$status;
	}else{
		$status = 2;
		$_SESSION['chart_id']=$status;
	}

	$db = new DB;
	$db->query("SELECT `team_name` as label, `marks` as y, CONCAT('[', `marks`, ' Marks]') AS indexLabel FROM `team_marks` WHERE `status`=:status");
	$db->bind(':status', $status);
	$rows = $db->resultSet();
	$db->close();
	$dataPoints = array();
	foreach($rows as $row){
		$dataPoints[] = $row;
	}
	echo json_encode($dataPoints, JSON_NUMERIC_CHECK);
  }
We will use this file to fetch data of status=2 when session status is 1 and status=1 when session status is 2.
You can fetch your updated data based on your system requirement. For demo purpose, we are fetching different data based on status value.
2. Update a Chart using JavaScript
Now, we need to update data in our already created chart, for this purpose we will make an AJAX request.
Make sure that you include the jQuery library before Canvas JS library in footer in index.php.
<script src="https://code.jquery.com/jquery-3.7.1.min.js"></script>Now, add the following code after the JavaScript code which was added for creating a chart.
refresh_data();

function refresh_data(){
    setTimeout(function()
    {
        $.ajax({
            type: "POST",
            url: "ajax.php",
            data: "request=data",
            success: function(data) {
                var data_points = JSON.parse(data);
                const arr = [];
                for (const key in data_points) {
                    if (data_points.hasOwnProperty(key)) {
                        arr.push(data_points[key]);
                    }
                }
                chart.options.data[0].dataPoints = arr;
                chart.render();
            }
        });
        refresh_data();
    }, 3000);
}Conclusion
We hope by now you have learnt how to create a chart using JavaScript and how to dynamically update chart using JavaScript.
If you found this tutorial helpful, share it with your friends and developers group.
We spent several hours to create this tutorial, if you want to say thanks so like our page on Facebook, Twitter and leave your reviews on Facebook and share it with other developers.
Facebook Official Page: All PHP Tricks
Twitter Official Page: All PHP Tricks